> ## Documentation Index
> Fetch the complete documentation index at: https://docs.nodexpanel.com/llms.txt
> Use this file to discover all available pages before exploring further.
# Node Overview
> See the status, servers, and resource usage of a node at a glance.
 ## Overview
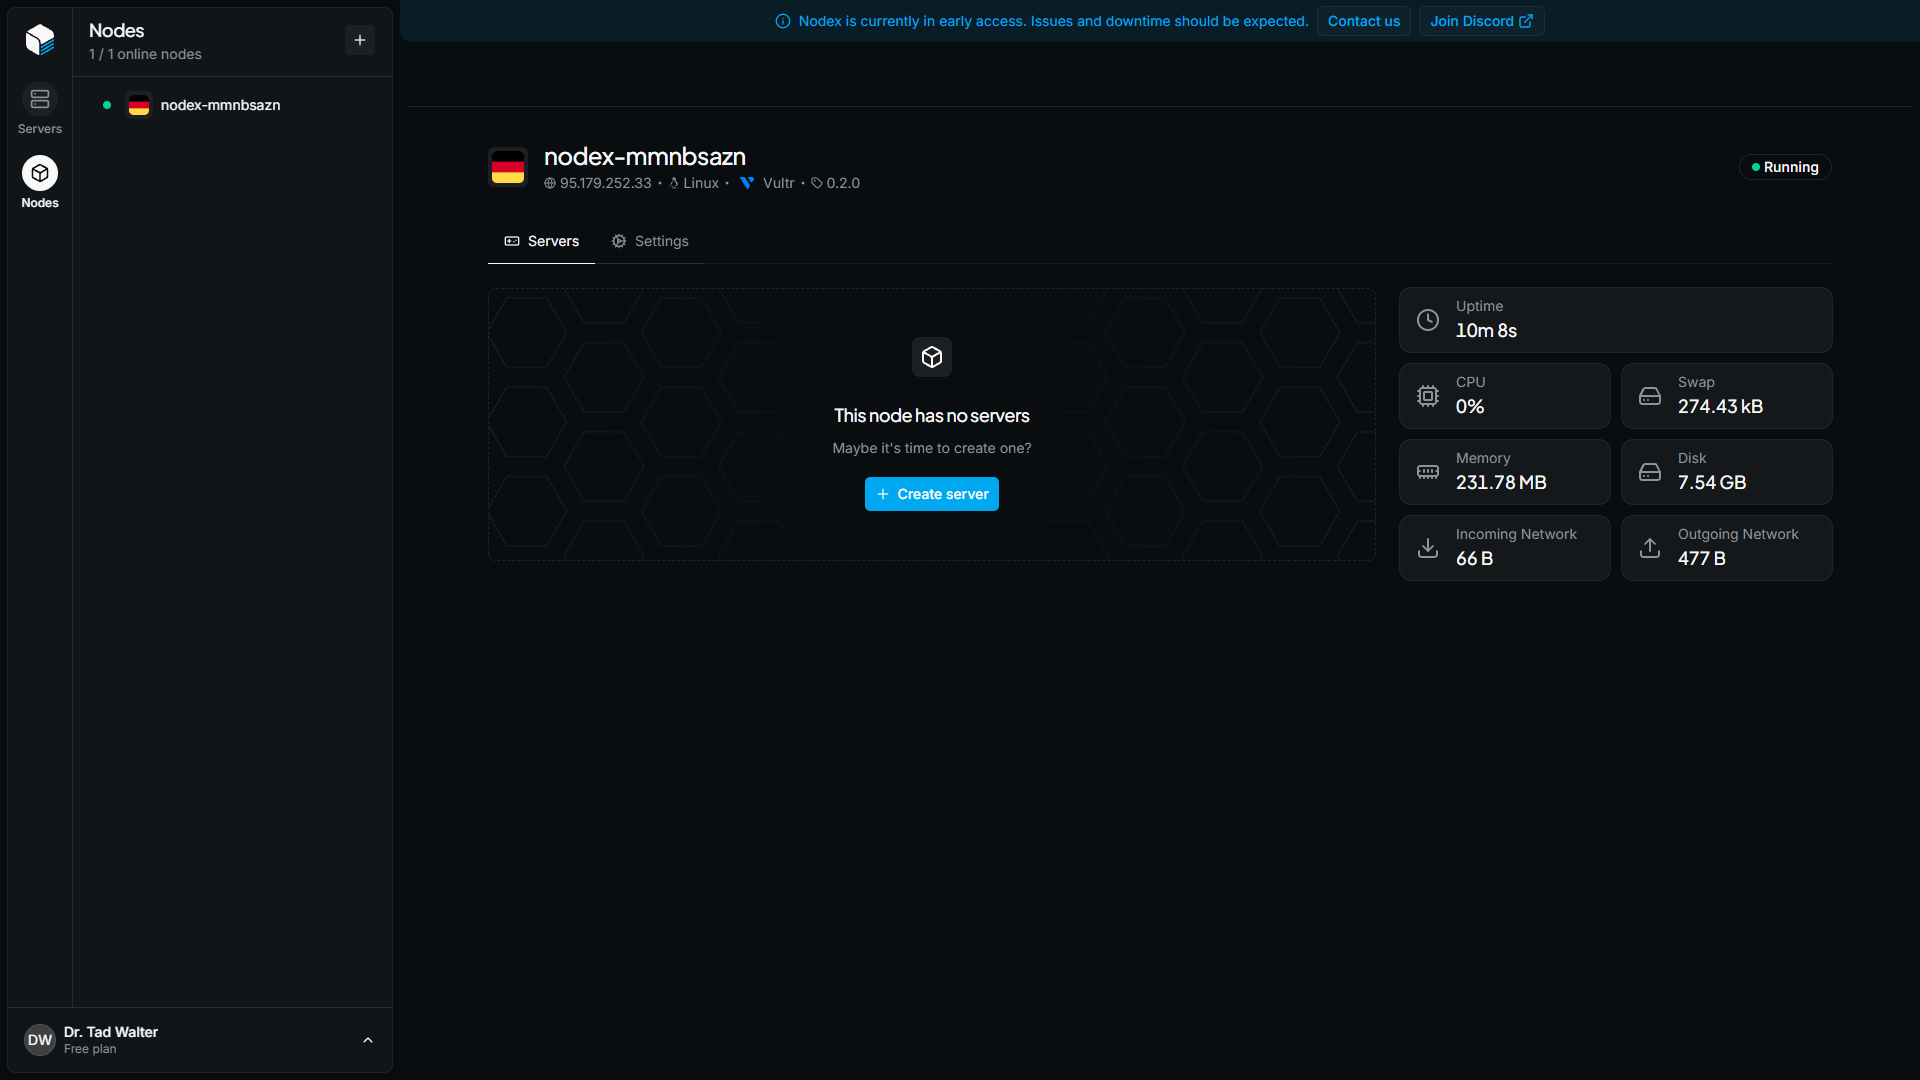
The node overview page is the home of a [node](/nodes). It shows whether the node is online, lists the servers running on it, and displays live resource usage.
To open it, click a node in the **Nodes** tab of the Nodex dashboard.
## Node header
The header at the top of the page identifies the node and shows its current state. From left to right, it displays:
* The node's name
* The node's IP address
* The operating system of the node
* The cloud provider the node was created with, or **Custom VPS** if you connected your own server
* The version of the Nodex agent running on the node
The badge on the right shows the node's state:
| State | Meaning |
| :- | :- |
| Running | The node is online and connected to Nodex. |
| Offline | Nodex cannot reach the node. |
| Provisioning | Nodex is setting up a node created through a cloud provider. |
| Requires Installation | A custom VPS node is waiting for you to run its install command. |
| Provisioning Failed | Nodex could not finish setting up the node. |
## Servers
The **Servers** section lists every server running on the node. For each server, the table shows:
| Column | Description |
| :- | :- |
| Title | The server's name. Click it to open the server's [overview](/server-overview). |
| IP | The address players use to join, made of the node's IP and the server's primary port. |
| Status | The server's [state or activity](/servers#server-states). |
| Players | The number of players online and the server's maximum, when the game reports it. |
| CPU | The CPU the server is currently using. |
| Memory | The memory the server is currently using. |
| Uptime | How long the server has been running. |
Values that Nodex cannot read, such as the resource usage of a stopped server, show **N/A**.
To add another server to the node, click the **+ Create Server** button at the top of the section. The node is preselected on the [server creation page](/servers#create-servers).
## Resource usage
The panel on the right shows how much of the node's resources are in use. The values update live while the page is open.
| Metric | Description |
| :- | :- |
| Uptime | How long the node has been running since its last boot. |
| CPU | The processor load of the whole node. |
| Swap | The swap space in use. |
| Memory | The RAM in use. |
| Disk | The disk space in use. |
| Incoming Network | The amount of data the node has received. |
| Outgoing Network | The amount of data the node has sent. |
If the node is offline, its metrics cannot be updated. Check that the machine is running, then reload the page.
This documentation is built and hosted on [Mintlify](https://mintlify.com), a developer documentation platform.
## Overview
The node overview page is the home of a [node](/nodes). It shows whether the node is online, lists the servers running on it, and displays live resource usage.
To open it, click a node in the **Nodes** tab of the Nodex dashboard.
## Node header
The header at the top of the page identifies the node and shows its current state. From left to right, it displays:
* The node's name
* The node's IP address
* The operating system of the node
* The cloud provider the node was created with, or **Custom VPS** if you connected your own server
* The version of the Nodex agent running on the node
The badge on the right shows the node's state:
| State | Meaning |
| :- | :- |
| Running | The node is online and connected to Nodex. |
| Offline | Nodex cannot reach the node. |
| Provisioning | Nodex is setting up a node created through a cloud provider. |
| Requires Installation | A custom VPS node is waiting for you to run its install command. |
| Provisioning Failed | Nodex could not finish setting up the node. |
## Servers
The **Servers** section lists every server running on the node. For each server, the table shows:
| Column | Description |
| :- | :- |
| Title | The server's name. Click it to open the server's [overview](/server-overview). |
| IP | The address players use to join, made of the node's IP and the server's primary port. |
| Status | The server's [state or activity](/servers#server-states). |
| Players | The number of players online and the server's maximum, when the game reports it. |
| CPU | The CPU the server is currently using. |
| Memory | The memory the server is currently using. |
| Uptime | How long the server has been running. |
Values that Nodex cannot read, such as the resource usage of a stopped server, show **N/A**.
To add another server to the node, click the **+ Create Server** button at the top of the section. The node is preselected on the [server creation page](/servers#create-servers).
## Resource usage
The panel on the right shows how much of the node's resources are in use. The values update live while the page is open.
| Metric | Description |
| :- | :- |
| Uptime | How long the node has been running since its last boot. |
| CPU | The processor load of the whole node. |
| Swap | The swap space in use. |
| Memory | The RAM in use. |
| Disk | The disk space in use. |
| Incoming Network | The amount of data the node has received. |
| Outgoing Network | The amount of data the node has sent. |
If the node is offline, its metrics cannot be updated. Check that the machine is running, then reload the page.
This documentation is built and hosted on [Mintlify](https://mintlify.com), a developer documentation platform.